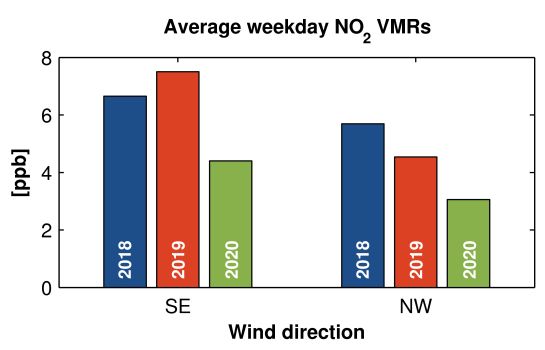
As recently observed over Corona hotspots like East China or Northern Italy, a notable drop in NO2 pollution as a consequence of restrictions to combat Coronavirus is also found over the city of Vienna. Horizontal measurements of the BOKU MAX-DOAS instrument were analyzed and compared with data from equivalent periods of the former years 2018 and 2019.
Spring 2020 - Coronavirus Lockdown reduces NO2 pollution in Vienna
The figure shows that about 40% less NO2 amounts are observed on average in the period starting from 19.03.2020 and ending before Easter Weekend, when compared to 2018 and 2019. Most of this drop is related to a significant reduction of motor traffic in and around Vienna during that time.
Raw data from a Vaisala CL51 ceilometer, which is operated by ZAMG, were converted into vertical aerosol extinction profiles by scaling the data with AOD from the AERONET station and compared with vertical aerosol extinction profiles retrieved from co-located MAX-DOAS measurements using BOREAS.
Fall and Winter 2019/2020 - Comparison of vertical aerosol extinction profiles derived from co-located MAX-DOAS and Ceilometer instruments
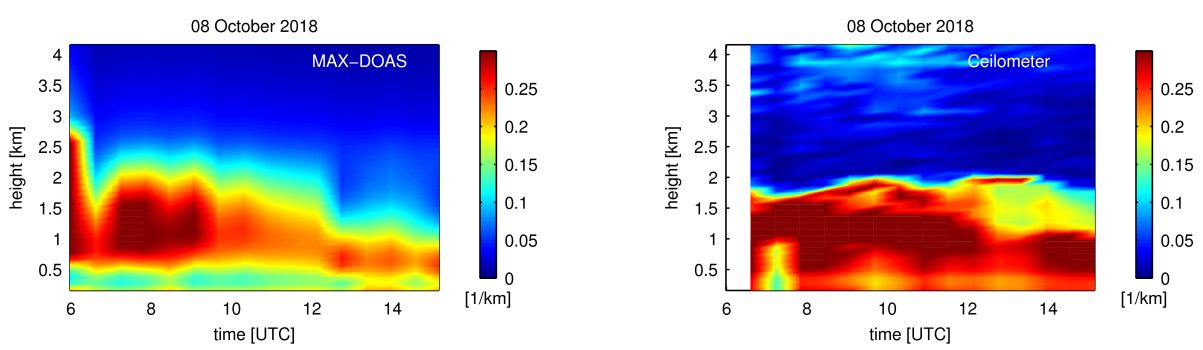
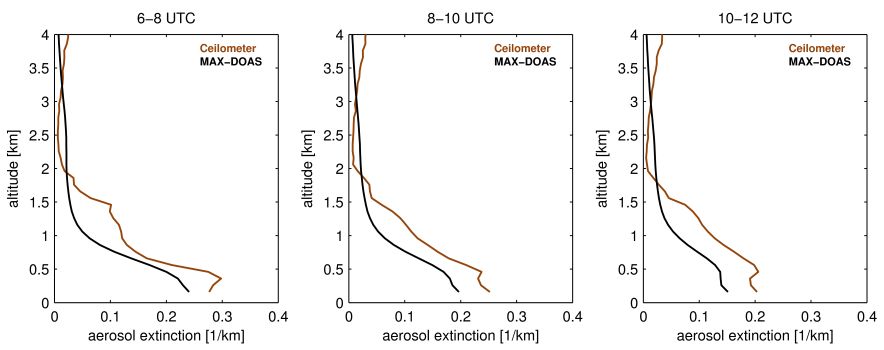
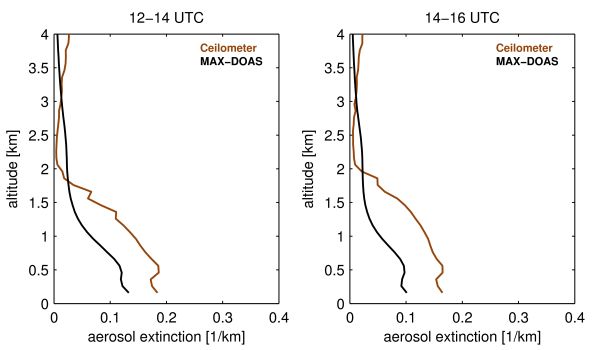
Overall, good agreement with a systematic offset is found when data products of the two instruments are compared with each other. Here, one exemplary day as well as mean vertical aerosol extinction profiles for the fall period are presented.
Recently, an azimuth sequence was added to the existing elevation sequences, which are currently operating at the six defined azimuth directions of the three instruments.
Summer 2019 - Spatial distribution retrieval of NO2 for the urban environment of Vienna
The newly added azimuth sequences are 11 consecutive measurements (in approximately 10° azimuthal angle steps) towards the location of the city center as well as towards the location of the other instruments.
These scans take place approximately every 45 minutes at fixed elevation angles of α = 3° (VETMED instrument), α = 1° (BOKU instrument), and α = 0° (Arsenal instrument).
First results of the spatial distribution retrieval are shown in the figure above for an exemplary azimuthal sequence (4 June 2019, 16:00 CET). Clearly, highest values show up in the Southwest of the city center, which is in good agreement with wind direction (winds from the East), resulting in transport of polluted air masses arising from industrial areas and heavy roads (located in the Southeast of the city center) to the West.
Vertical profiles of NO2 and aerosols are retrieved using the Bremen Optimal estimation REtrieval for Aerosols and trace gaseS (BOREAS).
Spring 2019 - Retrieval of vertical NO2 and aerosol profiles in Vienna
The left and right figures show exemplary vertical profiles of NO2 and aerosols, respectively, as retrieved from measurements of the Arsenal MAX-DOAS instrument on 20 September 2018, which was a day in Vienna with low wind speeds and thus, relatively high pollution levels.
Tropospheric NO2 vertical column densities (VCDs) retrieved from ground-based measurements (e.g. MAX-DOAS) are an important source of information for satellite validation.
Within the VINDOBONA project, three MAX-DOAS instruments have recently been set up and since then these instruments continuously deliver measurements that can be used for validation of TROPOMI, which was launched in October 2017.
Fall and Winter 2018/2019 – Comparison of NO2 vertical column densities retrieved from the MAX-DOAS measurements with Tropomi observations
Overall, high correlation is found between NO2 VCDs retrieved from MAX-DOAS and ‘nearest-pixel’ Tropomi measurements (28 overpasses on days with cloud-free skies).
However, Tropomi observations are lower by a factor of about 2-3. This might be caused by errors in air mass factors, which are needed for the conversion of slant into vertical column densities, and also due to an inhomogeneous distribution of NO2 inside such a satellite pixel.
Klick here for more information: 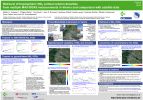 (Download, pdf, 2.0 MB)
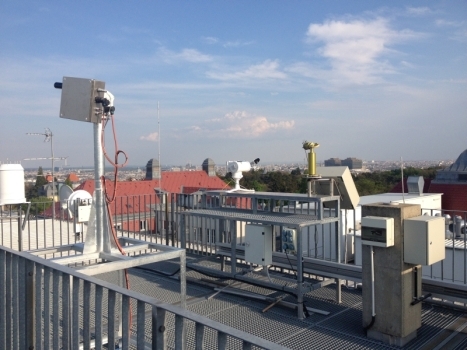
The third MAX-DOAS instrument was set up in August 2018 at the Arsenal site. The instrument performs measurements between 290 and 550 nm (ultraviolet & visible wavelength range).
Summer 2018 - Set up of the MAX-DOAS instrument at the Arsenal site and car DOAS zenith-sky measurements in the Inntal Valley
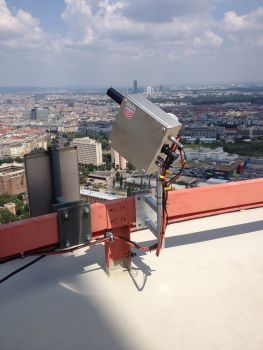
Currently, six azimuthal viewing directions between 325 and 20° are selected to capture the city center and point into the direction of the two other MAX-DOAS instruments. The elevation sequence is the same as for the VETMED and BOKU, but additionally includes α = -1°.
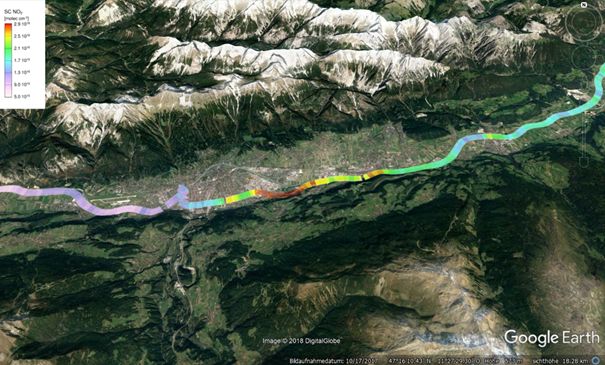
Within the IAO-IOP measurement campaign (organized by ACINN ), a couple of Car DOAS measurements were performed on three days between the cities Schwaz and Kematen. First results indicate that highest NO2 amounts are found during the morning hours in the east of Innsbruck.
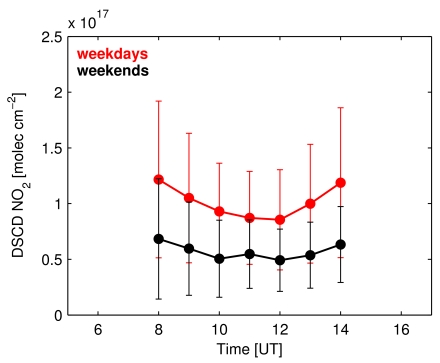
The effect of wind direction on tropospheric NO2 amounts over the city center of Vienna were evaluated by analyzing DSCDs from the VETMED MAX-DOAS instrument (α = 3° and azimuth angle towards city center).
Winter and Spring 2017/2018 - NO2 levels under different wind conditions
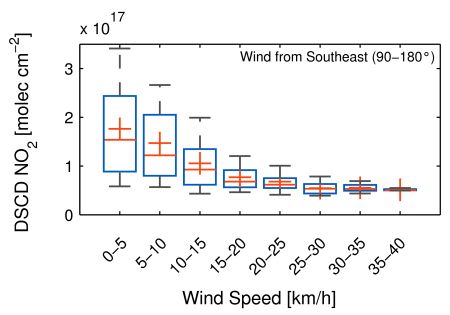

Highest NO2 levels are observed when the wind is blowing with a light breeze from southeastern directions. When the wind is blowing from the West, tropospheric NO2 amounts are clearly smaller and the influence of wind speed is less strong than for the other case.
Klick here for more information:  (Download, pdf, 2.7 MB)
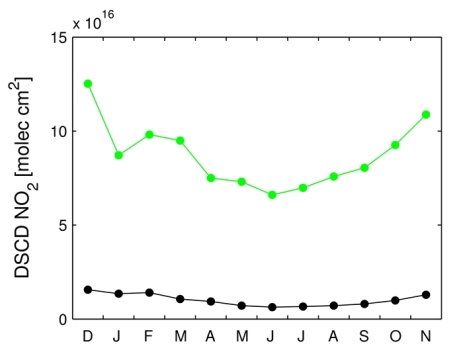
Summer and Fall 2017 - First seasonal NO2 cycle obtained from measurements of both instruments
Since NO2 has strong absorption lines in both the ultraviolet and visible regions of the spectrum, this trace gas can be obtained from measurements of both instruments. There is a clear seasonal cycle of NO2 DSCDs as obtained from the visible MAX-DOAS instrument at α = 3° (green line, left panel). While averaged values are highest in winter, lowest values are observed during summer months.
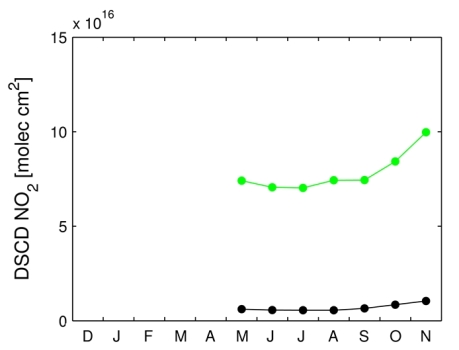
The NO2 DSCDs retrieved from the UV instrument at α = 1° (green line, right panel), starting in May 2017, show similar values for the summer and fall months - the difference in lowest elevation angles (1° vs. 3°) might be partly compensated by the altitude difference of the two measurement sites (approximately 100 m). Monthly means of NO2 DSCDs observed at α = 30° (black lines) are also in good agreement.
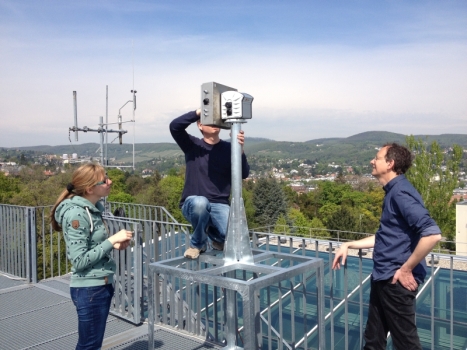
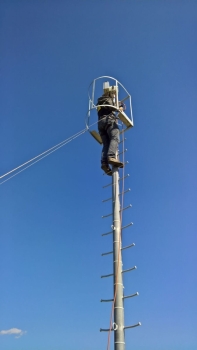
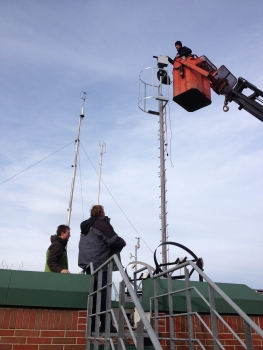
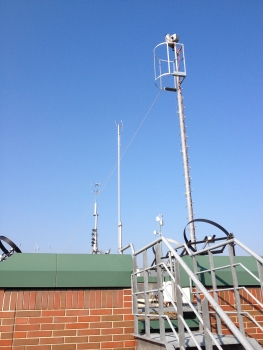
Spring 2017 - Set up of the MAX-DOAS instrument at the BOKU site
The second MAX-DOAS instrument was set up in April 2017 at the BOKU site. The instrument performs measurements between 299 and 399 nm (ultraviolet wavelength range).
Currently,
six azimuthal viewing directions between 74 and 213° are selected to capture busy roads and industrial areas as well as rather residential areas. The elevation sequence is the same as for the instrument at the VETMED site.
After the installation of the MAX-DOAS instrument and selection of viewing directions at the BOKU site, viewing directions at the VETMED site have been modified. Currently, six azimuthal viewing directions are selected at the VETMED site. The settings of both instruments include one azimuthal viewing direction pointing in direction of the other instrument.
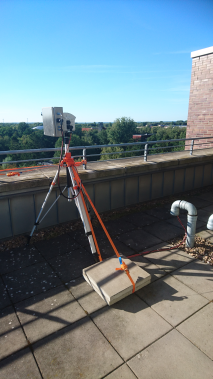
Winter 2016/17 - Set up of the MAX-DOAS instrument at the VETMED site and first results
In December 2016, the first MAX-DOAS instrument was set up at the VETMED site. The spectrometer performs measurements between 398 and 534 nm (visible wavelength range).
Currently, measurements are obtained in three different viewing directions with a corresponding elevation sequence of 0°, 1°, 2°, 3°, 4°, 5°, 10°, 15°, 30°, and 90° (zenith). Once the second instrument will be set up at the BOKU site, viewing directions of the VETMED instrument will be modified.
After four months of measurements, first analyses were conducted. NO2 DSCDs were derived applying the DOAS analysis.

The diurnal cycle of NO2 DSCDs for different viewing directions and different months was obtained. Two NO2 maxima are found - one in the morning and one in the evening.
Klick here for more information:  (Download, pdf, 2.0 MB)
Summer and Fall 2016 - MAX-DOAS and car DOAS zenith-sky measurements in Cabauw, The Netherlands
After successful test measurements in Bremen, the BOKU MAX-DOAS instrument was transferred to Cabauw, The Netherlands, where it participated in the
CINDI-2
(Cabauw Intercomparison of Nitrogen Dioxide Measuring Instruments 2) project.
Amongst more than twenty other MAX-DOAS-type instruments, the BOKU MAX-DOAS instrument recorded spectra at predetermined elevation and azimuthal angles. The intensive measurement period lasted two weeks and luckily, contained a couple of ‘golden days’ days.
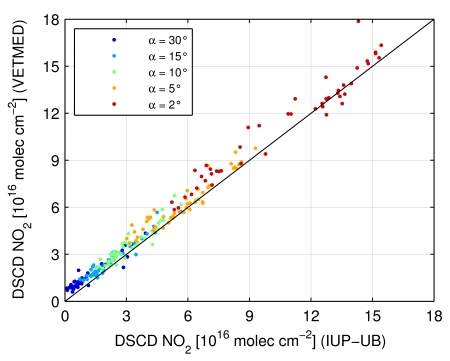
First results reveal good agreement of NO2 DSCDs when the measurements of the BOKU and IUP-UB MAX-DOAS instruments are compared with each other.
During the CINDI-2 campaign, a couple of Car DOAS measurements were performed on more than five days between the cities Utrecht and Rotterdam. Close to the urban areas, higher amounts of nitrogen dioxide are found - depending on wind direction.
Spring and Summer 2016 - MAX-DOAS set-up and first measurements in Bremen, Germany
After an extensive set-up phase in spring and summer 2016 at the IUP-UB laboratory, first outdoor measurements with the BOKU MAX-DOAS instruments could be performed in mid-August. The instrument recorded spectra at different elevation angles orientated towards west (in accordance with the IUP-UB MAX-DOAS instrument).
First retrieval results of the BOKU MAX-DOAS instrument are compared with NO2 DSCDs of the IUP-UB MAX-DOAS instrument. The agreement of NO2 DSCDs is better for higher than for lower elevation angles. Decreasing agreement towards the horizon might be the result of possible obstacles (e.g. trees) in the viewing direction and/or different field of view of the instruments.
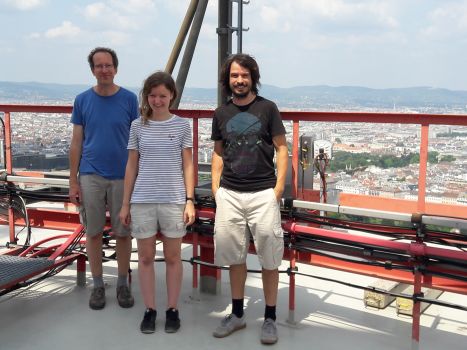
Spring 2016 - Tower DOAS off-axis measurements in Vienna, Austria
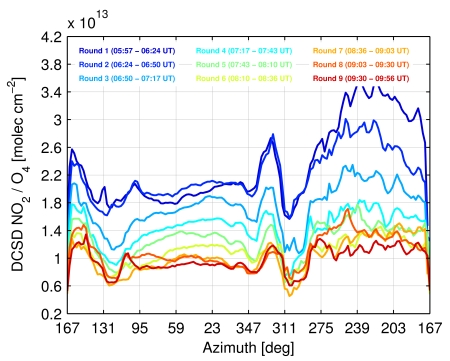
Off-axis DOAS measurements on the rotating platform of the Danube Tower in Vienna (about 160 m above ground) were carried out in spring 2016. In the morning of 10 May 2016, nine rounds, each lasting for about 26 minutes, were performed.
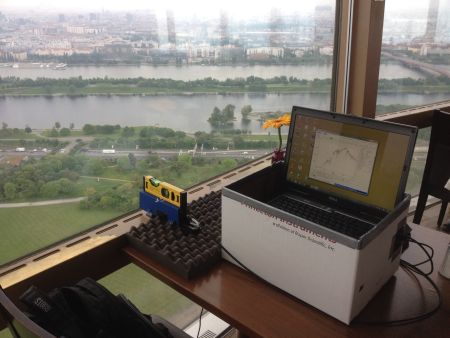
After the measurements taken in off-axis direction inside the tower through a glass window, a couple of zenith-sky measurements were recorded from the open terrace (about ten meters below). The DOAS analysis is applied for the retrieval of NO2 DSCDs in the visible spectral range.
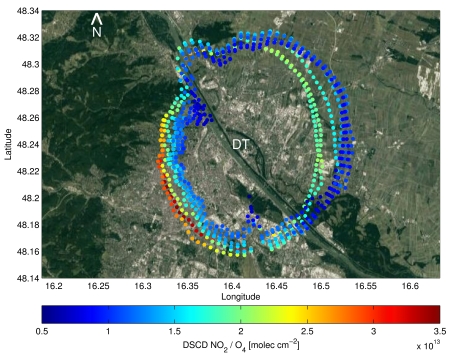
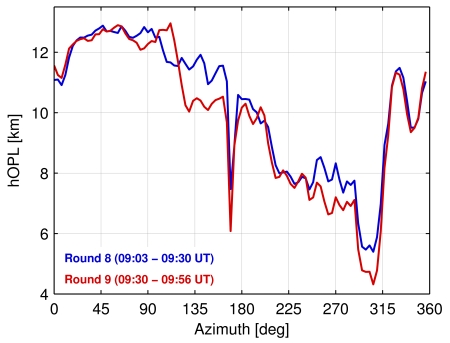
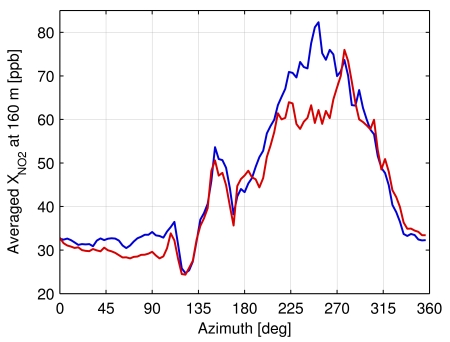
First results show a clear spatial variability in the distribution of NO2 on that day. The changing distance of dots from the Danube Tower (DT) is related to changes in light path length due to topography and aerosols.
Klick here for more information:
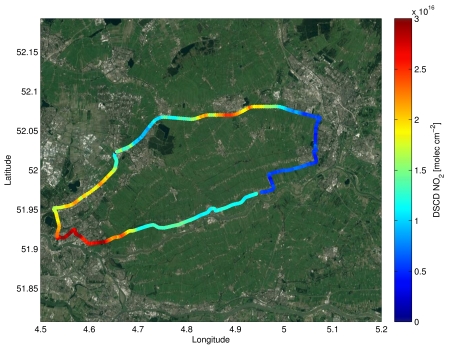
Spring and Fall 2015 - Car DOAS zenith-sky measurements in Vienna, Austria
Car DOAS zenith-sky measurements were carried out in spring and fall 2015 within the metropolitan area of Vienna, Austria. A total of three rounds, each having about 100 km distance and lasting for about 1.5 hours, were performed on 10 April 2015 – under clear sky conditions.
Differential slant column densities (DSCDs) of nitrogen dioxide (NO2) are obtained from the spectral measurements by applying the Differential Optical Absorption Spectroscopy (DOAS). The conversion of NO2 DSCDs into tropospheric NO2 vertical column densities (VCDtropo) is based on tropospheric and stratospheric airmass factors (AMFs). Additional data on wind speed and wind direction from nearby weather stations is used to interpret the horizontal and temporal evolution of tropospheric NO2 in Vienna. Moreover, in situ NO2 concentrations from more than a dozen surface stations (provided by the “Amt der Niederösterreichischen Landesregierung“ and “Amt der Wiener Landesregierung“) are utilized and compared with NO2 VCDtropo as derived from our car DOAS measurements.
We identified elevated NO2 pollution from industry nearby an oil refinery and from traffic above busy motorways. NO2 transport events along the Danube River throughout the morning hours could be observed. The comparison between NO2 VCDtropo and in situ NO2 concentrations shows reasonable agreement for this exemplary day.
Klick here for more information: