1. Trends in Total Ozone Content:
The depletion over the antartic continent
is a well known fact and Antarctica is far, far away. But there
is also a decrease of ozone over Europe and also over Austria.
During the last decades the annual mean of the ozone column
over Austria felt from 350 Dobson Units (DU) down to 315 DU. This
is a decrease of 10 % within 40 years or a decrease of 0.25%
per year. Note that: 300 Dobson Units is equivalent to a 3mm
thick layer of pure ozone gas at NTP condition.

Progress of the Annual Mean Ozone 1950 to 2020
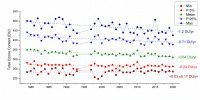
This figure visualizes the annual mean values for the location of Vienna (AUT), which have been reconstructed by COST726 (1950-2010) and measured by NASA's TOMS instruments (1978-2020).
Ozone Depletion
over Austria (Vienna) during the last 43 Years (1978-2020). This figure visualizes the
trends for the highest measured value within the year (Max), the 95% percentile (P95),
the annual mean (mean), the 25%-percentile (P25)
and the lowest measured value (Min).
Linear Trends over Vienna:
For Linear regression date from 1979 to 1992 (TOMS), from 1997 to 2004 (EPTOMS) and from 2005 to 2020 (OMI) were used.
Linear Regression: Y = k*X + A
The correspondign trends are indicated in units
of [DU/Year]:
Max: -1.2 DU/yr, p<0.001 (1979-2015: -1.44 DU/yr)
P 95%: -0.71 DU/yr, p<0.001 (1979-2015: -0.66 DU/yr)
Mean: -0.64 DU/yr, p<0.001 (1979-2015: -0.55 DU/yr
P 5%: -0.24 DU/yr, p<0.03 (1979-2015: -0.28 DU/yr
Min: -0.03 DU/yr, n.s. (1979-2015: -0.04 DU/yr
2.Ozone Mini Hole over Austria:
December 1999
The picture below shows the amount of total
ozone over Vienna within the past years (July1996-December 2000).
The total ozone column was measured by NASA's EPTOMS Satellite.
As you can see, in Dec. 1997 and Dec. 1999 dramatically
short-term decreases occur. The TOC values went under 200DU. Such
events are called Ozone-Mini-Holes. Frequency,
size and intensity of these events inreases corresponding to the
general depletion of the ozone layer.
 Ozone over Vienna (1996-2000)
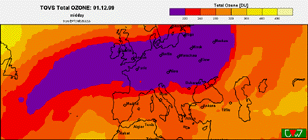
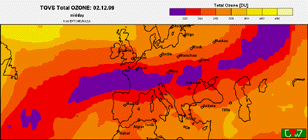
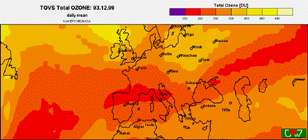
At the end of November 1999 extreme low
values of total ozone content were observed over Europe. The
values underwent the limit of 220 Dobson Units. As defined by
UNEP, areas of such low values are called Ozone Holes. They are
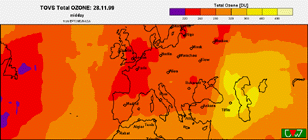
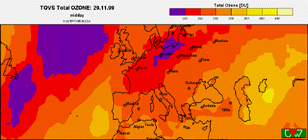
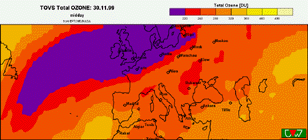
colored as violet in the following sequence of pictures. The
Ozone Mini Hole over Europe was present from Nov. 28th to Dec. 2nd.
History:
Nov. 28th, 1999: Low Values occure
over North America.
Nov. 29th, 1999: Large aera of low
values grows around Greenland.
Nov. 30th, 1999: A further decrease
of total ozone content covers northern Europe.
Dec. 1st, 1999: The Ozone Hole moves
down to the Mediteranean Sea.
Dec. 2nd, 1999: The ozone layer
starts to rebuilt.
Dec. 3rd, 1999: A level is reached
which is still low, but above the limit of 220 DU.
Last modification: August 2021 by Alois.Schmalwieser(at)vetmeduni.ac.at


