
Steady-state balance model to calculate
the indoor climate of livestock buildings demonstrated for finishing pigs
G. Schauberger, M. Piringer, E. Petz
Günther
Schauberger
Institute of Medical Physics and Biostatistics
University of Veterinary Medicine Vienna
Veterinärplatz 1, A 1210 Vienna, Austria
Fax: +43 (1) 250 77 4390
Martin
Piringer and Erwin Petz
Central Institute for Meteorology and Geodynamics
Hohe Warte 38, A 1190 Vienna, Austria
The indoor climate of livestock buildings is of importance for the well-being and health of animals and their production performance (daily weight gain, milk yield, etc.). By using a steady-state model for the sensible and latent heat fluxes and the CO2 and odour mass flows, the indoor climate of mechanically ventilated livestock buildings can be calculated. These equations depend on the livestock (number of animals and how they are kept), the insulation of the building and the characteristics of the ventilation system (ventilation rate). Since the model can only be applied to animal houses where the ventilation systems are mechanically controlled (this is the case for a majority of finishing pig units), the calculations were done for an example of a finishing pig unit with 1000 animal places. The model presented used 30 min values of the outdoor parameters temperature and humidity, collected over a 2-year period, as input. The projected environment inside the livestock building was compared with recommended values. The duration of condensation on the inside surfaces was also calculated.
Keywords: indoor climate ·
livestock building ·
steady-state model ·
finishing pig ·
air quality
1. Introduction
The performance of farm animals is a result of the genotype of the animals and parameters like nutrition, hygiene, livestock management as well as the abiotic environment. This environment should fulfil the requirements of the animals to improve the performance of the livestock. An adequate physical environment for the animals should be provided by the livestock building and the ventilation system. The physical environment of farm animals inside livestock buildings is primarily characterised by hygro-thermal parameters and air quality. These parameters are influenced by the interaction with the outdoor situation on the one hand and the livestock, the ventilation system and the building on the other hand. This interaction can be modelled by the steady-state balance equation for the sensible and latent heat and the carbon dioxide mass balance (Albright, 1990; CIGR, 1984; ASHRAE 1972; Baxter, 1984; Pedersen et al., 1998). During winter time, when the recommended thermal conditions have to be achieved by restrictions of the ventilation rate, air quality is of major interest. During summer time, adequate heat removal by the ventilation system is the crucial point. On the basis of these balance equations, models are used to describe the complex system behaviour of the indoor climate of livestock buildings. Such models can be used for several purposes: first of all to ensure that the essential needs of the animals are metand to optimise the indoor climate to increase animal performance (eg Hartung, 1994). Furthermore, this can also be seen as a contribution towards the reduction of the amount of drugs used to treat environmentally caused diseases (Straw, 1992).
The model can be used in two modes: first in a prognostic mode (Schauberger 1988a and 1989) e.g. for the purpose of designing the ventilation system and the renovation of existing livestock buildings; secondly, in a diagnostic mode, when measured values of the indoor climate are compared with model calculations. Such methods can be used as a part of herd health control (Schauberger et al., 1995) as well as to check the design values of the ventilation system and its control unit (e.g. DIN 18910, 1992; CIGR, 1984).
Airborne emissions from livestock husbandry (eg Wathes, 1994) are also of interest when discussing green house gases like CO2, N2O and CH4, ecologically relevant gases like NH3 (eg Graedel and Crutzen, 1993), micro-organism and odour. The last component especially can reduce the acceptability of livestock farming in the vicinity by malodour (Schiffman, 1998). By combining a indoor climate model with the odour release of the animals within a livestock building, the diurnal and annual variation of the odour emission of the farm can be calculated (Schauberger et al., 1999). The aim of this paper is to apply a steady-state balance model in prognostic mode to assess the indoor climate [hygro-thermal parameters and air quality (CO2, odour)] on the basis of 30 min values. The result is discussed for a 1000-head pig finishing unit.
2. Material and Method
2.1 Meteorological Data
Meteorological data like temperature, relative humidity, wind direction and wind speed are needed to calculate the climate inside the livestock building and the odour emission. For this evaluation, data were collected at Wels, a site representative of the Austrian flatlands (200 to 400 m above sea level) north of the Alps. The sample interval was 30 min for a two-year period between 30 January 1992 and 31 January 1994.
The selected area is characterised by a moderate climate with both maritime and continental influences. The annual average temperature is 9 - 10°C. Precipitation occurs all year round, culminating in summer storms, and annual precipitation totals of 700 to 1000 mm. In general, the area is ventilated well, with mean wind speeds ranging from about 2 to 4 m/s. Apart from north-south-oriented valleys, the main wind directions are west and east.
The city of Wels in Upper Austria is a regional shopping and business centre of about 50.000 inhabitants. The annual mean temperature at Wels is 9,7 °C, the temperature range (2-year period) is from 14,9 °C to 35,3 °C. The annual precipitation amounts to 838 mm (mean for the period 1961 1990).
The balance equation for sensible heat (Eq. 1) consists of three terms:
SA + SB + SV = 0 (1)
relating the sensible heat release of one animal, SA, the gain or loss of sensible heat caused by the transmission through the building, SB, and the sensible heat flow associated with the ventilation system, SV.
The sensible heat release of the animal is part of the total heat production, QA (CIGR, 1984) which is proportional to the metabolic mass of the animal (m.75), and the relative portion, fs, of the total energy release that appears as sensible heat is fs=0.6 (Pedersen et al., 1998). The evaporation on wet surfaces (manure, feed, condensation) is considered by a correction factor, ks, with a constant value of .95 (CIGR, 1984). Thus,
![]() (2)
(2)
The diurnal variation of the total heat production is taken into account by a sinusoidal function proposed by Pedersen and Takai (1997) on the basis of the variation of the animal activity over the time of day, t, and the period t=24h. The amplitude for finishing pigs is assumed to be ± 45% of the daily mean value (Pedersen and Rom, 1998). Minimum animal activity of finishing pigs can be observed around 1:15 local time at night (Pedersen, 1996; Pedersen and Takai, 1997). Therefore,
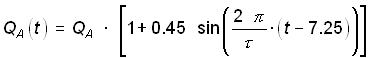 (3)
(3)
The sensible heat loss due to the transmission through the building, SB, is calculated by the mean value of the thermal transmission coefficient U weighted by the areas of the different construction elements (walls, ceiling, doors, windows), the mean area of all these elements, A, and the temperature difference between outdoor (To) and indoor air (Ti) (Owen, 1994).
![]() (4)
(4)
The sensible heat flow due to the ventilation system, SV, is calculated by the volume flow V (m³/s), the heat capacity, c, (J/kg K), air density, r, (kg/m³) and the temperature difference between outdoor, To, and indoor air, Ti:
![]() (5)
(5)
The ventilation systems of livestock buildings are mainly designed as temperature-controlled variable volume flow systems. The control unit uses the indoor air temperature as control value. The supply voltage of the fans and therefore the resulting volume flow is the output of the control unit. Idealised characteristics of the ventilation system control unit are shown in Fig.1. Two parameters, the set point temperature, TC, and bandwidth (P-band), D TC, describe the course of the volume flow depending on the indoor air temperature Ti as a control value (e.g. Bruce, 1999, MWPS-32, 1990). For an indoor air temperature less than the set point temperature, the minimum volume flow is supplied. In the range of the P-band above the set point temperature, the volume flow is increased until the maximum ventilation rate is reached. Above this range, the livestock building is supplied by the maximum ventilation flow. Equation (6) gives the volume flow V as a function of the indoor air temperature Ti.
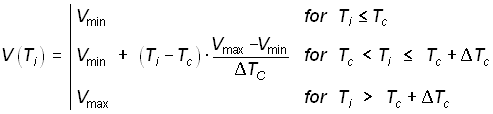 (6)
(6)
The latent heat balance (L) and the CO2 mass balance (C) are calculated by taking into account the moisture and CO2 release of the animals and the transport due to the ventilation system:
LA + LB + LV = 0 (7)
CA + CB + CV = 0 (8)
The term, describing the transport through the building shell LB and CB, can be neglected. The latent heat LA released by the animals is the difference between the total heat production QA, (Eq. 3, CIGR, 1984) and the sensible heat release SA (Eq. 2). The transport by the ventilation system is given by
![]() (9)
(9)
combining the volume flow, V (m³/s), the air density, r, (kg/m³), and the difference of the humidity ratio (kg/kg) between outdoor, xo, and indoor air, xi.,
The CO2 release by the animals and the manure storage, CA, is calculated via the total heat production, QA, (Eq. 3, CIGR, 1984) and the caloric equivalent of kc = 0.185 l/h W (Pedersen and Takai, 1997, Schauberger and Pilati, 1998a and 1998b; CIGR, 1994; Pedersen et al., 1998).
![]() (10)
(10)
The CO2 volume flow of the ventilation system is given by
![]() (11)
(11)
with the volume flow, V, (m³/s), and the difference of the CO2 concentration (l/m³) between outdoor, co, and indoor air ,ci.
The system parameters per animal place for a pig finishing unit with the chosen specifications are summarised in Table 1.
| Parameter | |
| Mean total energy release QA of an animal with a body mass of 60 kg (continuous finishing between 30 and 100 kg body mass) |
|
| Minimum volume flow Vmin, calculated by the maximum accepted indoor CO2 concentration of 3 l/m³ |
|
| Maximum volume flow Vmax, calculated by the maximum temperature difference between indoor and outdoor for summer (Ti=30°C) of 3 K |
|
| Area of the building (ceiling, walls, windows, doors) per animal place |
|
| Mean thermal transmission coefficient U weighted by the area of the construction elements (wall, ceiling, door, window) | 1.5 W/m² K |
|
Wall Ceiling Door Window |
.70 W/m²
K
|
| Set point temperature of the control unit TC |
|
| Bandwidth of the control unit D TC |
|
As odour production is a biochemical process, the temperature has an important influence on the odour release of the various sources. Most authors select the outdoor air temperature, To, instead of the more appropriate indoor temperature, because they were interested in the odour emission and not the odour release inside the livestock building (Oldenburg, 1989; Kowalewsky, 1981).The linear regression of Oldenburg (1989) was adapted to calculate the change of the daily mean odour flow, Em, by Eq. 12 as a function of the outdoor air temperature T0.
![]()
![]() (12)
(12)
For the model calculation no diurnal variation of the odour release was assumed.
The odour concentration inside the livestock building depends on the odour release and the volume flow of the ventilation system under the assumption that the odoriphores inside the livestock building are homogeneously mixed by the volume flow of the ventilation system. The concentration is calculated by the odour flow, E, (OU/s) divided by the volume flow, V, of the ventilation system (m³/s) as seen in Eq. 13.
![]() (13)
(13)
The air quality inside the livestock building was evaluated by the CO2 and the odour concentration. Levels used for CO2 were (MWPS-32, 1990, CIGR, 1994, CIGR, 1984; Wathes, 1994): good air quality below 2 l/m³, i. e. about seven times the normal atmospheric concentration of .35 l/m³; acceptable air quality between 2 and 3 l/m³; bad air quality above 3 l/m³. The threshold limit value (TLV) for workspace of humans (8 hours per day instead of 24 hours) is 5 l/m³ (ACGIH, 1991).
To evaluate the air quality in terms of odour, the relationship between odour concentration, cOD, and intensity of odour sensation I was used according to Misselbrook et al. (1993) and based on the Weber-Fechner law that the response is proportional to the logarithm of the stimulus. The following scale was used: 0 no odour, 1 very faint, 2 faint, 3 distinct, 4 strong, 5 very strong, 6 extremely strong.
![]() (14)
(14)
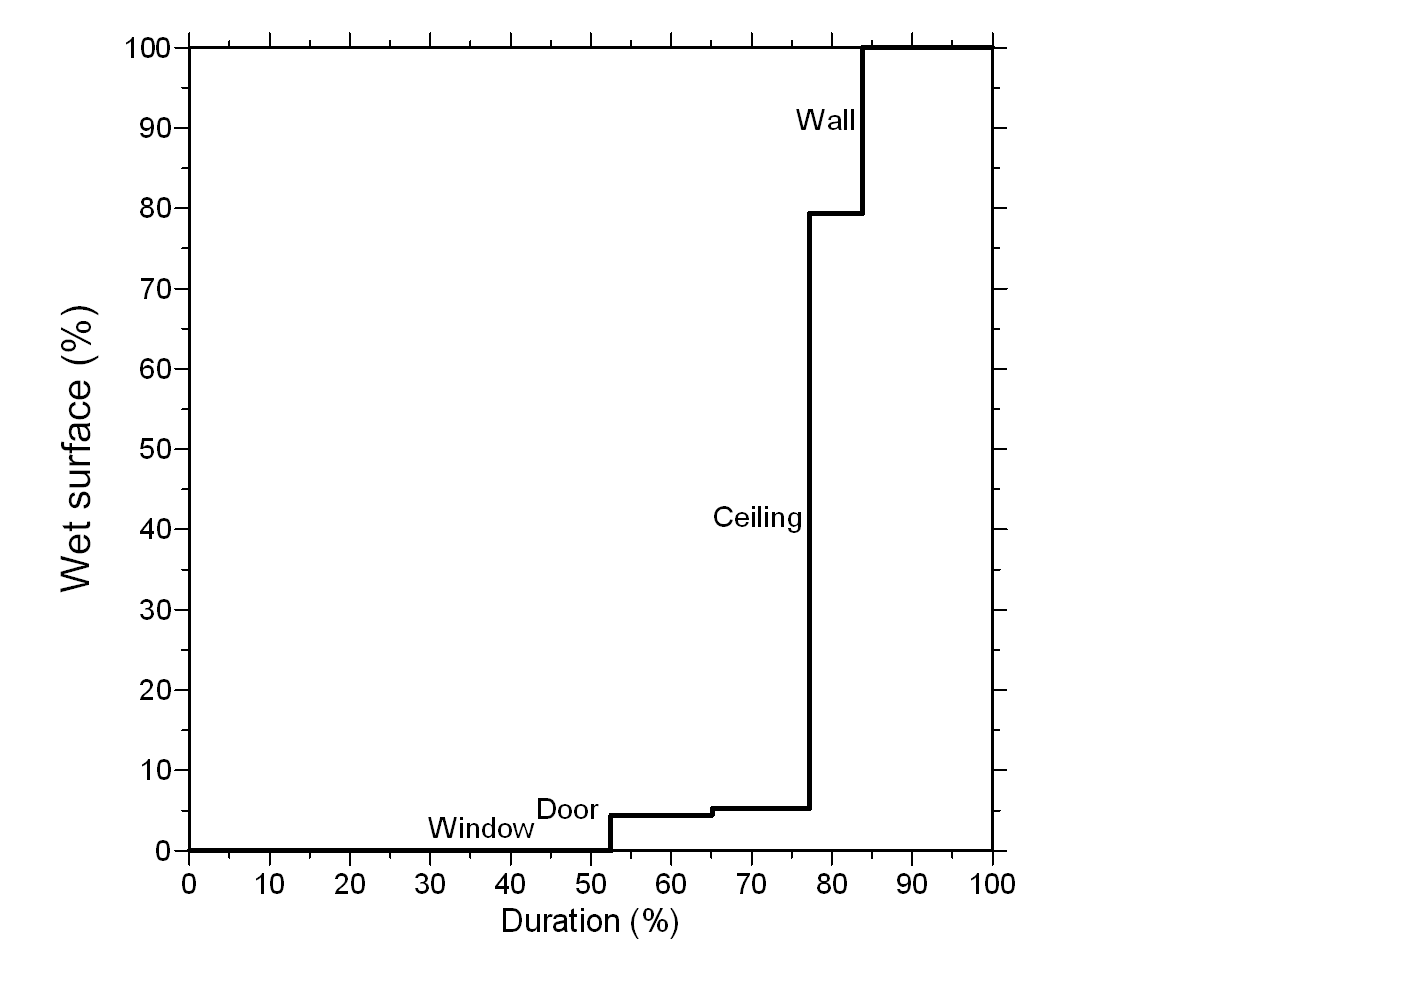
The occurrence of condensation because of insufficient insulation of the building and/or high indoor humidity levels was used to assess the amount of wet surfaces. For four types of construction elements (U value of walls, ceiling, windows and doors) the surface temperature was calculated. If the dew-point temperature of the indoor air is below these values, condensation is assumed.
3. Results
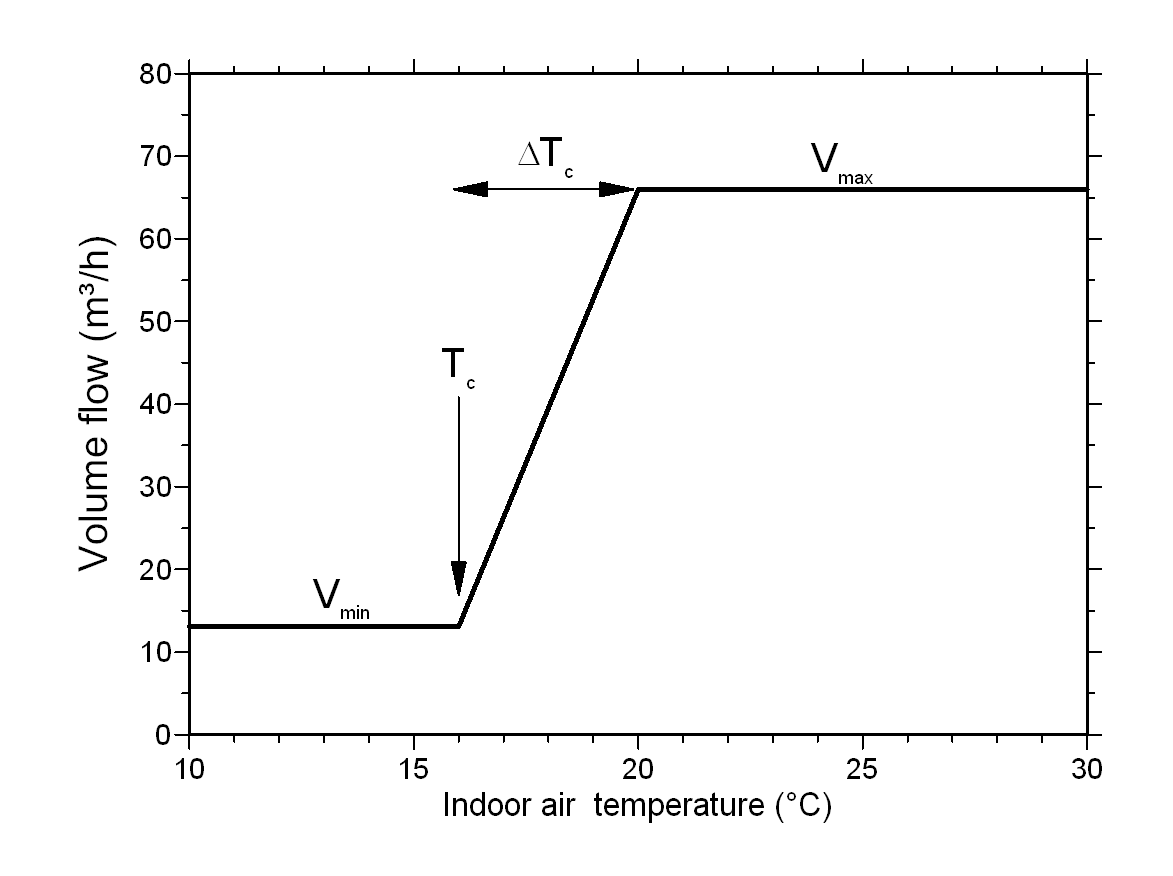
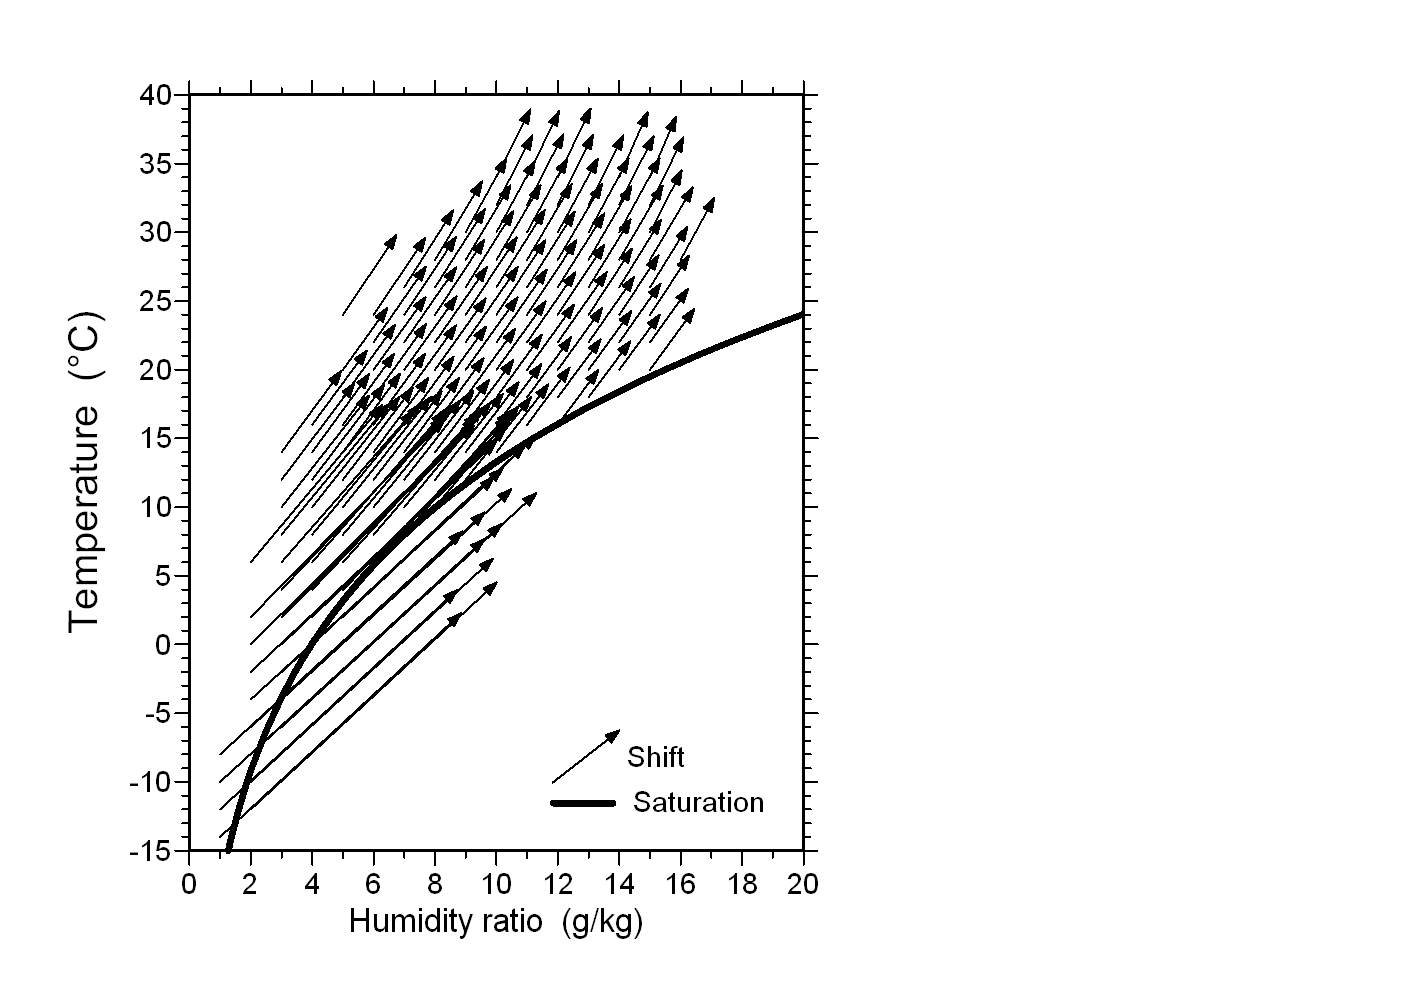
The thermal situation of the livestock building on the basis of the modelled indoor temperature was evaluated as a function of the outdoor temperature (Fig. 2). Three subsets can be distinguished on the basis of the indoor air temperature. (1) Below an indoor temperature that is the set point TC of the control unit, the indoor temperature cannot be controlled by the ventilation system because the minimum volume flow has to fulfil the requirements of the air quality needs of the animals. The change of the indoor temperature is then proportional to the change of the outdoor temperature as a result of the constant volume flow Vmin. (2) In the relatively small temperature range between TC and TC+D TC, the indoor temperature can be influenced by the ventilation system by changing the volume flow. (3) Above TC+D TC, the change of the indoor temperature is again proportional to the change of the outdoor temperature caused by a constant volume flow (Vmax). The volume flows for the three ranges are defined by Eq. 7.
The deviation from the optimum hygro-thermal environment was assessed by a 3x3 matrix of the duration of deviation (Tab. 2). 16% of the year falls into the central section with optimum temperature and humidity for the animals, 27% of the time it is too hot and about 17% of the time it istoo cold. During the cold period all observations show a relative humidity above the optimum range.
|
|
||||
|
|
||||
|
|
|
|
|
|
|
|
|
|
|
|
|
|
|
|
|
|
|
|
|
|
|
|
|
|
|
|
|
|
|
|
(W/m² K) |
(%) |
(m²) |
|
|
|
|
|
|
|
|
|
|
|
|
|
|
|
|
|
|
|
|
 a
a
 b
b
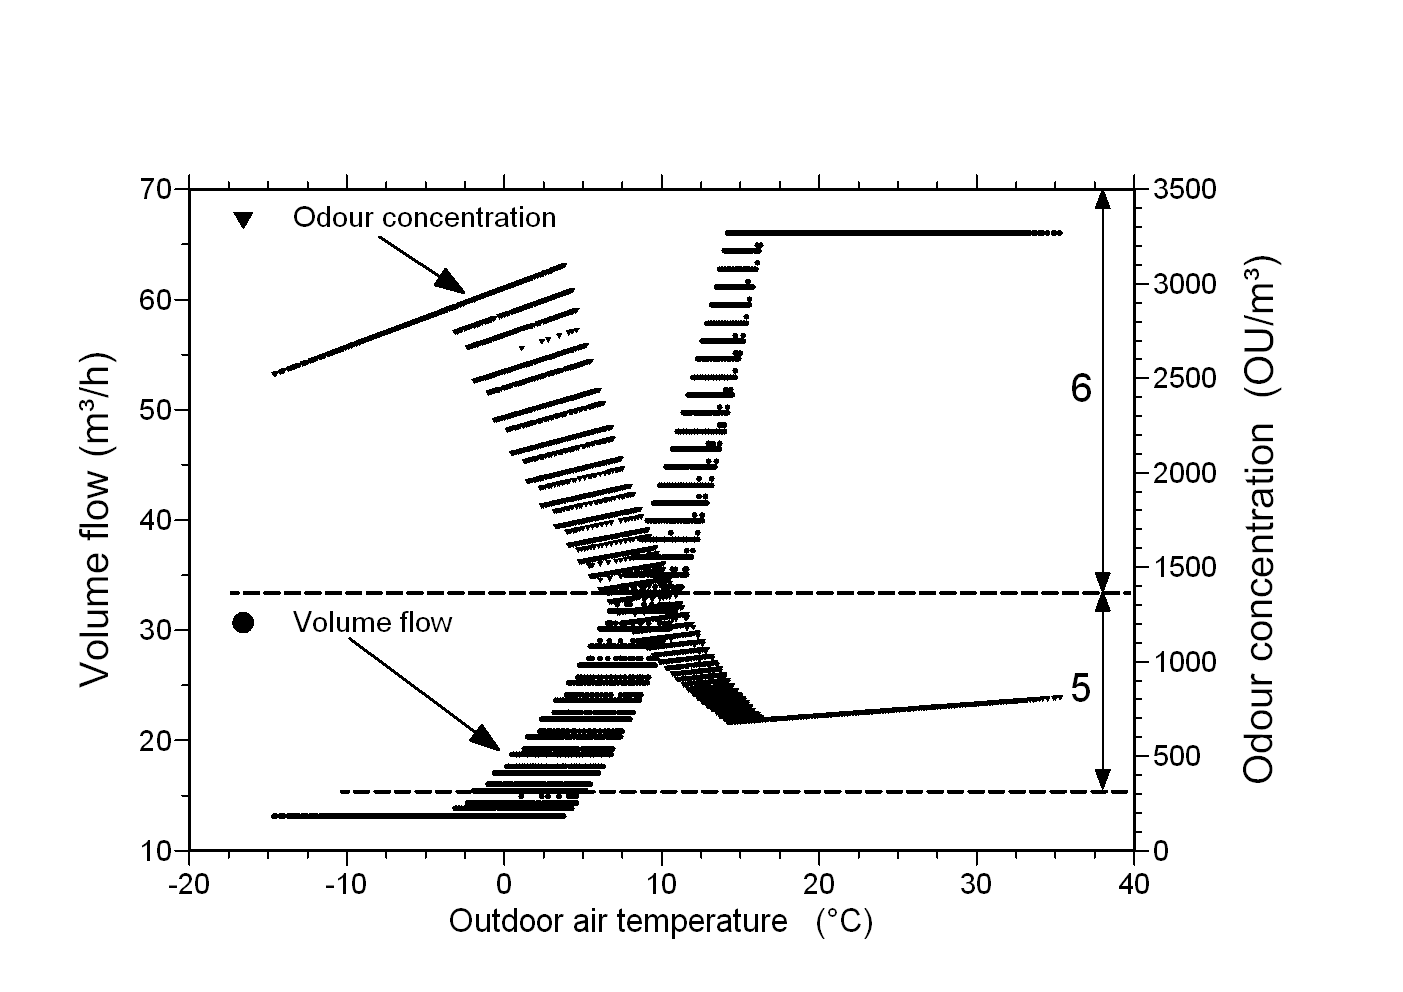
Figure 5: Volume flow and odour concentration (a) and volume flow and carbon dioxide concentration (b) as a function of outdoor temperature.
The time series of meteorological parameters used for this study is representative for the Austrian flatlands and the North-Alpine foreland. These are regions where, apart from valleys with their specific flow regimes, good ventilation conditions prevail throughout the year. Situations that can give rise to enhanced concentrations of pollution, like calm conditions, low-base temperature inversions or periodically changing wind regimes are not as frequently observed in these areas as in inner-Alpine valleys or in the basins south of the Alps. The results achieved here are applicable to all areas, especially in Central and Eastern Europe, that experience similar average temperatures and ventilation conditions, like large portions of Bavaria, Hungary, or Poland (Schauberger et al., 1999)
The model presented here describes mechanically ventilated livestock buildings. In Austria about 20% of cattle houses and 39% of pig houses (63% of finishing units) are mechanically ventilated (Schauberger et al., 1993). The model are especially appropriate for pigs and poultry (which are mostly housed in environment-controlled buildings) to investigate the system behaviour of the indoor climate, whereas sheep and cattle are often housed in naturally ventilated buildings (eg Cooper et al., 1998), in which the volume flow is caused by buoyancy and wind pressure (van t Klooster, 1994).
The steady-state balance model used has been validated for a wide range of input parameters, like the livestock, the insulation of the building, and the ventilation system by comparing measurements of the indoor climate with model calculations. For beef cattle, Schauberger and Pilati (1998a and 1998b) propose the following improvements: (1) diurnal variation of the total heat release due to the animal activity and (2) taking account of the evaporation from wet surfaces by a temperature dependent factor, ks, describing the portion of sensible heat used to transfer liquid water into the gaseous phase. Pedersen et al. (1998) have done the validation for cattle, pigs and poultry. Their modifications of the basic equations given in CIGR (1984) are used here to improve the balance model especially for the portion of the total heat which appears as latent heat. The constant value fs= 0.61 obtained by Pedersen et al. (1998) for the portion the total energy release that is sensible heat of the animals is in good agreement with the rationale of Webster (1994) that pigs and poultry have only limited ability to lose heat by evaporation at elevated air temperature.
Nevertheless, the assessment of evaporation from wet surfaces is important for the energy balance of livestock buildings (Økland, 1980; Albright, 1990; Mothes, 1973; Kapuinen, 1993; Schauberger and Pilati, 1998a and 1998b; Zappavigna and Liberati, 1997). A principle problem is that transpiration by animals (fs in Eq. 2) cannot be separated from the evaporation of wet surfaces (ks in Eq. 2) by measuring the different heat fluxes of a livestock building at the housing level. Whether it is appropriate to improve the model by a modification of the latent heat loss by the factor fs (proposed by Pedersen et al., 1998) or by evaporation through the factor ks is still an open question.
The temporal behaviour of livestock buildings can be described as steady-state. The storage capability of the system, mainly the walls and ceiling, can be neglected because the sensible heat flux due to the ventilation system dominates. Schauberger and Pilati (1998a and 1998b) found a time lag between indoor and outdoor temperature of about 60 min during summer time (high ventilation rate) and 80 min during winter time (low ventilation rate). By introducing the diurnal variation of the animals, causing a variation in energy and CO2 release (Eqs. 3 and 11), the model can be used on an hourly basis and not only on a daily basis (Pedersen and Takai, 1997; Pedersen and Rom, 1998; van Ouwerkerk and Pedersen, 1994). Since this increases the temporal resolution of the outdoor parameters (air temperature and humidity), 30 min mean values were used over a 2-year period in the current analyses instead of a two-dimensional frequency distribution of temperature and humidity (Schauberger, 1988) or simple design values for these parameters (Albright, 1990; CIGR, 1984).
The presentation of the results is a simple assessment of the indoor air quality with respect to animals and farmers. The thermal coupling between the outdoor and the indoor temperature is shown in the same way as Baxter (1984) proposed in his biolclimatic charts. Using such charst, the behaviour of the control unit can be assessed for diagnostic purposes in the field of herd health control (Schauberger et al., 1995).
Odour is a relevant parameter of indoor air quality for stockmen and farmers as well as an airborne emission in the vicinity of livestock buildings. The potential effects of odour on health are discussed by Schiffman (1998). Skinner et al. (1997) report that about a quarter of the complaints received by the Environmental Health Officers in the United Kingdom are related to odour. Inside the livestock building, the odour intensity is projected to be in level 5 (very strong) or 6 (extremely strong) all the time. Such high levels have to be judged by the fact that the relation of Misselbrook (1993) in Eq. 14 was derived for outdoor odour concentrations, where normally the expected concentration is close to zero.
Such high concentrations could have effects on the health as described by Schiffman et al. (1995), ranging from respiratory problems to nausea, fatigue, headaches and plugged ears as well as psychological symptoms.
Indoor carbon dioxide concentration is mainly selected as a key parameter to evaluate the indoor air quality in relation to animals (CIGR, 1994). Therefore the maximum concentration of 3 l/m³ is used as an criterion for poor air quality instead of 5 l/m³ as the threshold for a human workspace of (Fig. 5).
For design purposes, studies of the sensitivity of various system parameters (see also Tab.1) are helpful. Schauberger (1988b) used a static model for animal density, insulation of the livestock building, and the ventilation rate. Model calculations are also a useful tool for decisions on herd management. By comparing model calculations with measurements of the thermal environment inside animal buildings over longer times (eg 4-month finishing period for pigs), the design values of the ventilation system, the quality of the control unit and the influence of livestock management (eg feeding time) can be investigated (Schauberger et al., 1995).
Future work is needed to include further air pollution components like NH3, dust and micro-organisms in the model which are important to describe the risks to the health of animals and farmers (eg CIGR, 1994; Robertsen et al., 1990).
Besides the indoor climate, the emission characteristics of livestock buildings can bedescribed by such a model. In addition to gases like CO2, NH3 and N2O, the emission of airborne micro-organisms and odour are relevant to livestock production. Grant et al. (1994) and Wathes (1994) reported on the susceptibility herds to various diseases and their infection, caused by airborne micro-organisms. In many cases, the odour concentration of the outlet air is assumed to be static over the whole year. Schauberger et al. (1999) calculated the temporal course of odour emission to improve model calculations using a more realistic scenario.
The dispersion
of such substances can be described by well-known dispersion models, like
the Gaussian one. To apply dispersion models to airborne emissions, the
concentration of the substance and the volume flow of the outlet air have
to be known (Schauberger et al., 1999).
Acknowledgement
The project was partly funded by the
Jubiläumsfonds der Oesterreichischen Nationalbank (no 4745). The authors
wish to thank one anonymous reviewer for fruitful comments.
References
Bruce, J.M. 1999. Environmental control of livestock housing. In: Houssine Bartali, E., Jongebreur, A., Moffitt, D. (eds): CIGR Handbook of Agricultural Engineering. Volume II: Animal Production & Aquacultural Engineering. ASAE, St. Joseph, Minnesota. p 54-87.
Albright LD (1990) Environment control for animals and plants. ASAE Textbook Nr. 4, St. Joseph: American Society of Agricultural Engineers
ASHRAE (1972): Handbook of fundamentals. Environment control for animals and plants - Physiological considerations. (Chapter 8). Am. Soc. of Heating, Refrigeration and Air-Conditioning Engineers, p151-166
Baxter S (1984) Intensive Pig Production: Environmental management and design. Granada, London p 87
CIGR Commission International du Genié Rural (1984) Climatization of Animal Houses. Aberdeen, Scottish Farm Buildings Investigation Unit
CIGR Commission International du Génie Rural (1994) Aerial Environment in Animal Housing - Concencentration in and Emission from Farm Buildings. Rennes CEMAGREF
Cooper K, Parsons DJ, Demmers T (1998) A thermal balance model for livestock buildings for use in climate change studies. J of Agricultural Engineering Research 69: 43-52
Crutzen PJ, Graedel TE (1993) Atmospheric Change : An Earth System Perspective. New York Oxford, Freeman.
DIN 18910 (1992): Wärmeschutz geschlossener Ställe. Berlin-Köln, Beuth
Grant RH, Scheidt AB, Rueff (1994) Aerosol transmission of a viable virus affecting swine: explanation of an epizootic of pseudorabies. Int. Journal of Biometeorology 38: 33-39
Hartung J (1994) Environment and animal health. In: Wathes CM, Charles DR (Eds): Livestock Housing. Wallingford, CAB International, p25-48
Kapuinen P (1993) Humidity production from moist surface in cow stables. In Collins E, Boon C (eds) 4th International Livestock Environmental Symposium, American Society of Agricultural Engineers, St. Joseph, Michigan, p859-866
Kowalewsky HH (1981) Messen und Bewerten von Geruchsimmissionen. Chemische und sensorische Bestimmung des Geruchs in der Umgebung von Ställen, offenen Füllbehältern und begüllten Feldern. KTBL-Schrift 260, Darmstadt: Kuratorium für Technik und Bauwesen in der Landwirtschaft e.V. KTBL
Martinec M, Hartung E, Jungbluth Th (1998) Geruchsemissionen aus der Tierhaltung (Literaturstudie). pp68, Baden-Würthenberg: Ministerium f Umweld und Verkehr
Misselbrook TH, Clarkson CR, Pain BF (1993) Relationship between concentration and intensity of odour for pig slurry and broiler houses. J of Agricultural Engineering Research 55: 163-169
Mothes E (1993) Stallklima. Berlin, Landwirtschaftsverlag, p 37-41
MWPS-32 Midwest Plan Service (1990) Mechanical ventilating systems for livestock housing. Iowa State University, Ames Iowa
Økland H (1980) An Investigation of vapor production from wet surfaces in animal rooms. Department of Agricultural Structures, Agricultural University of Norway. Internal report, Ås, Norway
Oldenburg J (1998) Geruchs- und Ammoniak-Emissionen aus der Tierhaltung. KTBL-Schrift 333. Darmstadt, Kuratorium für Technik und Bauwesen in der Landwirtschaft e.V. KTBL
Owen JE (1994) Strucures and materials. In: Wathes CM, Charles DR (eds) Livestock Housing. Wallingford, CAB International, p183-248
Pedersen S (1996) Døgnvariationer i dyrenes aktivitet i kvæg-, svine- og fjerkræstalde. Internal report 66. Horsens, Danish Institute of Animal Science, p83-84
Pedersen S, Rom HB (1998) Diurnal variation in heat production from pigs in relation to animal activity. Oslo: International Conference on Agricultural Engineering AgEng 98
Pedersen S, Takai H (1997) Diurnal Variation in animal heat production in relation to animal activity. In Bottcher RW, Hoff StJ (eds) 5th International Livestock Environmental Symposium. American Society of Agricultural Engineers, St. Joseph, Michigan, p664-671
Pedersen S, Takai H, Johnsen J, Birch H (1996). Ammoniak og støv i kvæg-, svine og fjerkræstalde II. Delresultater fra EU-projekt PL 900703. Ammonia and Dust in Cattle, Pigs and Poultry Houses II. Subresults from EU-project PL900703. (in Danish). National Institute of Animal Science, Denmark, report No. 65, 54 pp
Pedersen S, Takai H, Johnsen JO, Metz JHM, Groot Koerkamp PWG, Uenk GH, Phillips VR, Holden MR, Sneath RW, Short JL, White RP, Hartung J, Seedorf J, Schröder M, Linkert KHH, Wathes CM (1998) A comparison of three balance methods for calculating ventilation rates in livestock buildings. J of Agricultural Engineering Research 701: 25-37
Robertson JF, Wison D, Smth WJ (1990) Atrophic rhinitis: the influence of areal environment. Animal Produktion 50: 173-182
Schauberger G (1988a) Ein quasi-stationäres Bilanzmodell zur Stallklima-Simulation. Deutsche Tierärztliche Wochenschrift 95: 200 - 205
Schauberger G (1988b) Sensitivitätsanalyse einiger Parameter auf das Stallklima. Berliner Münchner Tierärztliche Wochenschrift 101: 77 - 81
Schauberger G (1998) Computersimulation des Stallklimas am PC in der tierärztlichen Praxis. Berliner und Münchner Tierärztliche Wochenschrift 102: 58 - 63
Schauberger G, Grosse Beilage E, Grosse Beilage Th, Pilati P, Rubel F (1995) Stallklimaüberwachung - ein Beitrag zur Bestandsbetreuung. Wiener Tieräztliche Monatsschrift 82: 299-308
Schauberger G, Pilati P (1998a) Evaluation of a steady-state balance model to simulate the indoor climate inside livestock buildings: A comparison with measurements of a cattle house. Int. Conference on Agricultural Engineering, AgEng 98, Oslo p 101-102
Schauberger G, Pilati P (1998b) Evaluierung eines quasi-stationären Bilanzmodells zur Stallklimasimulation: Vergleich mit Messungen eines Rindermaststalles. Wiener Tierärztl Monatsschrift 85: 49-55
Schauberger G, Piringer M, Petz E (1999) Diurnal and annual variation of odour emission of animal houses: a model calculation for fattening pigs. J of Agricultural Engineering Research 74: 251-259
Schauberger G, Wudy W, Cernohorsky W (1993) Statistisch-repräsentative Erhebung der Stallklimasituation in Rinder- und Schweineställen in Niederösterreich - Tierbestand, Gebäude und Lüftung. Wiener Tierärztliche Monatsschrift 80: 364-374
Schiffman S, Sattely Miller E, Suggs M, Graham B (1995) The effect of environmental odors emaniting from commercial swine operations on the mood of nearby residents. Brain research bulletin 37: 369-375
Schiffman SS (1998) Livestock Odors: Implications for human health and well-being. Journal of Animal Science 76: 1343-1355
Skinner JA, Lewis KA Bardon KS, Tucker P, Catt JA, Chambers BJ (1997) An overview of environmental impact of agriculture in the U.K.. Journal of Environmental Management 50: 11-128
Straw B (1992) Controlling pneumonia in swine herds. Veterinary-Medicine 87: 78-86
van Ouwerkerk ENJ, Pedersen S (1994) Application of the carbon dioxide mass balance method to evaluate ventilation rates in livestock buildings. XII CIGR World Congress on Agricultural Engineering, Milan. Proceedings, Volume 1, pp 516-529
van t Klooster, CE (1994) Implementation of natural ventilation in pig houses. PhD Thesis, Wageningen, Univ Wageningen
Wathes CM (1994) Air and surface hygiene. In: Wathes CM, Charles DR (eds) Livestock Housing. Wallingford, CAB International, p123-148
Webster AJF (1994) Comfort and injury. In: Wathes CM, Charles DR (eds) Livestock Housing. Wallingford, CAB International, p49-68
Zappavigna P, Liberati P (1997) Towards a more comprehensive approach to the environmental control in hot climate. In: Bottcher RW, Hoff StJ (eds) 5th International Livestock Environmental Symposium. American Society of Agricultural Engineers, St. Joseph, Michigan, 686-693